- Structural Engineering
- UHPFRC
- DIC
- Materials Science
Testing UHPFRC Bridge Beams with Digital Image Correlation
Full-field DIC on ultra-high-performance fibre-reinforced concrete beams: strain, deflection, and failure mode versus an HPC control.
The United States infrastructure is aging in public. The I-10 in Southern California, the I-75 southbound in Cincinnati, the I-35W over the Mississippi in Minneapolis — each failure was rare enough to feel like an outlier, and common enough that the American Society of Civil Engineers now grades national infrastructure at D+, with a rehabilitation bill north of $3.6 trillion. The search for a more durable bridge deck has pushed materials science toward Ultra-High Performance Fiber-Reinforced Concrete (UHPFRC): a cement matrix laced with steel fibers, near-zero porosity from high binder content, and an unconfined compressive strength of 21.75–36.26 ksi — two to four times ordinary concrete. First produced by Aalborg in Denmark in the 1960s, UHPC is still young enough that its structural limits under load are an open question. This study was one attempt to close some of that gap.
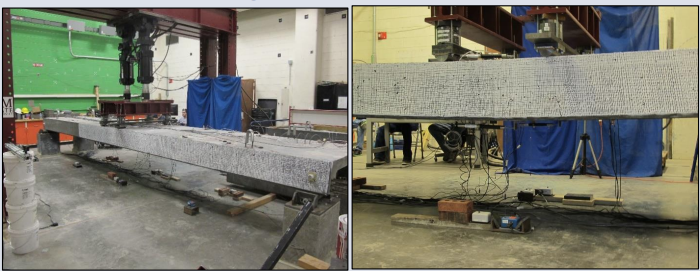
The instrument that made the work tractable was Digital Image Correlation. DIC replaces strain gauges with cameras: the specimen is sprayed with a stochastic speckle pattern, and computer vision tracks each speckle’s displacement between frames. Where a gauge measures a point, DIC measures a field — strain everywhere, over the entire visible face of the beam, at every load step. Three DIC systems covered three zones on the setup shown above: HiSpec on the midspan, GoPro on the shear span, and a 2M industrial camera on the beam end.
Objectives
The goal was to trace how UHPC beams deform under load, tracking the three parameters civil engineers actually design around: strain, crack opening, and deflection. Concretely:
- Evaluate beam behaviour under progressively applied load.
- Determine the cracking moment.
- Determine the failure moment.
- Analyse strain fields with Aramis, the DIC processing software from GOM.
- Study top-fibre and bottom-fibre strain curves at each load step.
- Use the strain field to compute the migrating neutral axis at each stage.
- Trace gamma shear deformation across the shear span.
Specimens and setup
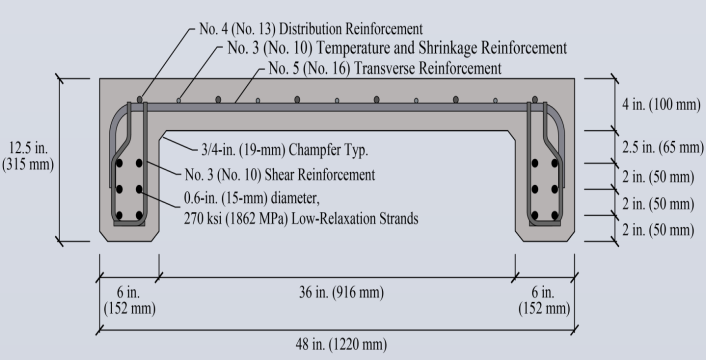
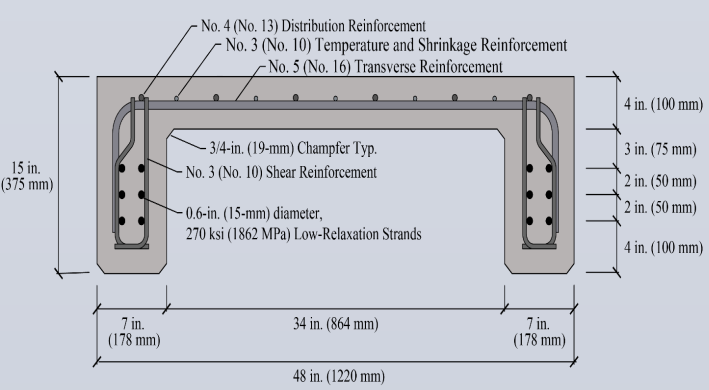
Testing was carried out at New Mexico State University. Two beams were prepared — one HPC (high-performance concrete, as control) and one UHPFRC — each 25 feet long with a C-shaped cross section. Each beam was set on a structural frame with the supports 24 feet apart, leaving 6 feet overhanging at each end. Load was applied by two hydraulic actuators, each positioned 1 foot from the beam’s centerline, driving the midspan into three-point bending. Both specimens received a stochastic speckle pattern rolled onto the surface after cure. The two specimens shared the same reinforcement layout but differed in overall depth, so the geometric contribution to capacity could be isolated from the material one.
Procedure was disciplined but unglamorous: set the beam on the frame, rig the three DIC systems, boot Aramis, link the cameras, calibrate against a plate, lower the loading head to just above midspan, apply load at the designated rate. Frames were captured every ~10 kips of applied load so the loading history could be reconstructed in strain space, not just in the dial gauge readout.
Results — strain
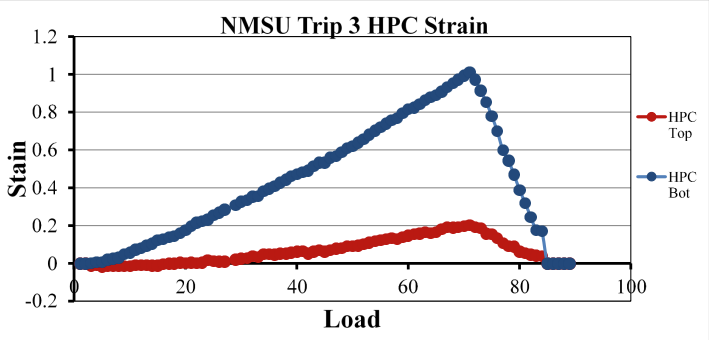
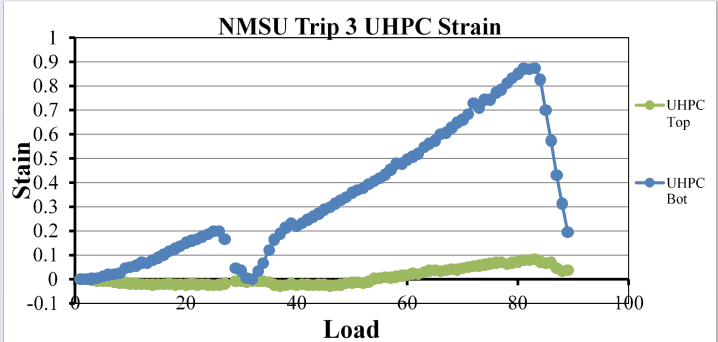
Under three-point bending, a beam concaves opposite the external force. Material above the neutral axis compresses; material below stretches. Because concrete has strong compression and weak tension, the bottom fibre always strains harder than the top — and the failure mechanism starts there.
The HPC control confirmed the textbook. Bottom-fibre strain climbed to0.99% while top-fibre strain peaked around 0.20% at first crack, which appeared at 41.645 kips. The UHPFRC beam followed the same shape but at lower magnitudes: 0.86% at the bottom, 0.08% at the top, with first crack pushed out to 55.852 kips— a ~34% increase in cracking load. The steel fibres do exactly what they claim to do: bridge microcracks, dampen tensile strain, delay the crack front.
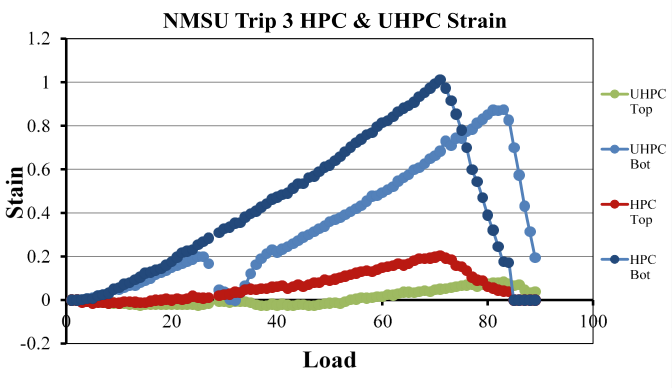
The compiled comparison makes the tensile-capacity argument concrete: the UHPFRC beam does not simply crack later — at every point on the load history it strains less than HPC, top and bottom. That is the fibre effect showing up not as a single failure statistic but as a shift in the whole stress-strain curve.
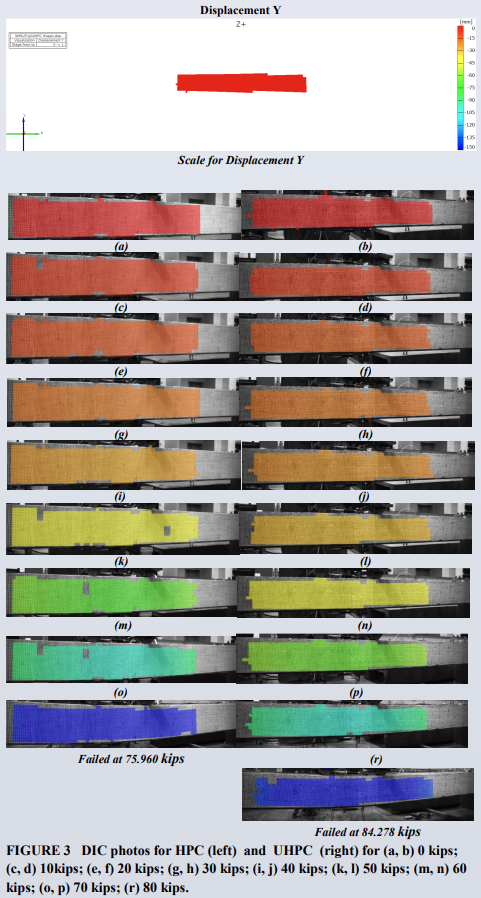
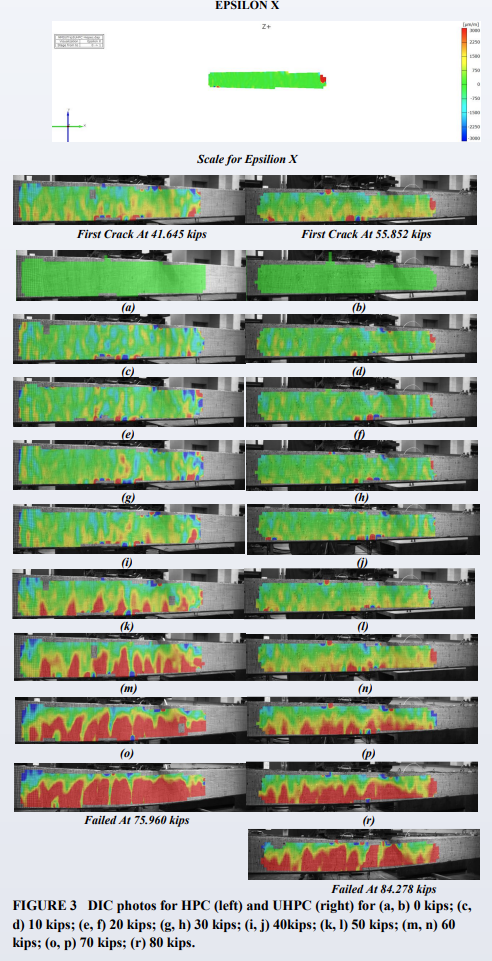
The single-number curves compress the story; the DIC fields tell it frame-by-frame. Below are the two full galleries used to trace the loading history: the εx(strain in the beam’s longitudinal direction) gallery and the displacement Y(vertical deflection) gallery. HPC sits on the left in each subpanel and UHPC on the right, at 0 through 80 kips in 10-kip increments.
Results — deflection
Vertical deflection is the second story the DIC systems recorded. Red maps to zero millimetres of downward movement; blue maps to −150 mm. Early in the load history both beams are almost pure red — nothing has moved. By the final steps colour has migrated deep into the green and blue range as the beam deflects tens of millimetres.
Results — neutral axis and failure
Because DIC gives strain across the whole face, the neutral axis — the locus where compressive strain flips to tensile — can be extracted at every load step, not just estimated from statics. In both beams the neutral axis started near mid-height and migrated upward as loading progressed. The compressive region shrank; the tensile region grew. When the compressive band became too thin to carry the applied moment, the section failed.
The HPC control failed at 75.960 kips. The UHPFRC beam sustained load to 84.278 kips— an 11% improvement in ultimate capacity on top of the 34% improvement in first-crack load. The fibres cost pennies per pound and buy that margin; they also change the failure mode from a brittle single crack into a distributed cracking pattern that gives visible warning before collapse. For a bridge deck that difference matters more than the headline number.
What the numbers mean for infrastructure
The point of the study was never to certify a specific mix design. It was to demonstrate that DIC turns a UHPC beam into a full-field strain laboratory, and that even at the small scale of a single specimen the material outperforms its conventional counterpart on the two measurements owners actually care about: when the first crack appears, and when the section finally lets go.
Scaled to a deck girder, the same fibres that pushed first crack from 41.6 kips to 55.9 kips buy engineers a longer service life under fatigue loading, a slower ingress path for chlorides and corrosion, and a real chance at bringing the ASCE report card off D+.
Acknowledgments
This work was supported by NSF award HRD-1202008, University of Texas at Tyler, Department of Civil Engineering.
References
- Aging Infrastructure: Issues, Research, and Technology. American Society of Civil Engineers, retrieved August 2015.
- Bragança, L., Koukkari, H., Veljkovic, M., & Borg, R. Sustainable Construction.
- Ljmu. Progress in Utilising Limestone Quarry Waste Dust as Road Base and Subbase Material.
- American Society of Civil Engineers, Report Card for America’s Infrastructure, D+ grade.